We have some exciting news to share! The Motley Fool UK has now become The Twelfth Magpie -- an independent, UK-owned company, led by our long-serving UK management team — Mark Rogers, Chris Nials and Heather Adlington. In practical terms, it’s the same team you know, now fully focused on serving our UK readers and members.

Just as importantly, our approach remains unchanged: long-term, jargon-free, and on your side. This site is our new home, and there will be extra tweaks made across the coming few days as we settle in. So if anything looks a little off, please bear with us!

The content of this article was relevant at the time of publishing. Circumstances change continuously and caution should therefore be exercised when relying upon any content contained within this article.

10.5% yield! Here’s what the charts say for the Vodafone dividend

The Vodafone dividend looks huge right now after passing the 10% mark. Do these four charts make it look like a great buy? Or one to be avoided?

| More on:
Smiling white woman holding iPhone with Airpods in ear

Image source: Getty Images

You’re reading a free article with opinions that may differ from The Motley Fool’s Premium Investing Services. Become a Motley Fool member today to get instant access to our top analyst recommendations, in-depth research, investing resources, and more. Learn More.

A 10.5% yield! That’s how high the Vodafone (LSE: VOD) dividend has risen. It’s eye-catching, for sure, but is it a good buy?

To answer, I won’t be focusing on the short term. A single year can be misleading, and the last thing I want to do is throw my money in at the top only to see the dividend slashed and my shares tumble in value. 

XXX

What I’ll do instead is zoom out a little. Doing this, with the help of charts made at TradingView, I can spots trends in that dividend. Those trends can help me see how reliable that 10% payout is. And in Vodafone’s case, I think these four charts give a very revealing answer. 

What do the charts say?

Source: TradingView

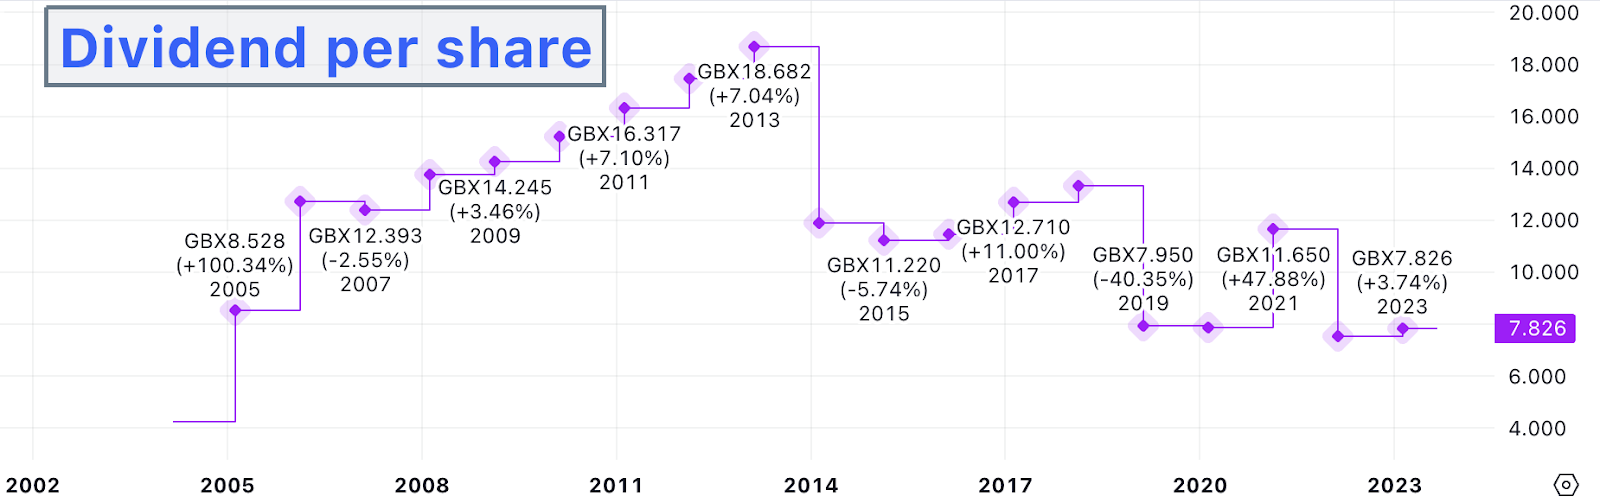
This first chart shows dividend per share. The striking detail here is that it has barely increased for years. Remember, Vodafone reports in euros, so some of the change in that graph will be due to currency conversion. 

The cut in 2020 was understandable. Lots of companies did the same due to Covid. Still, the dividend does seem to be stagnating. 

Not a good start, but this alone is not enough information to make a decision. Let’s explore further. 

Source: TradingView

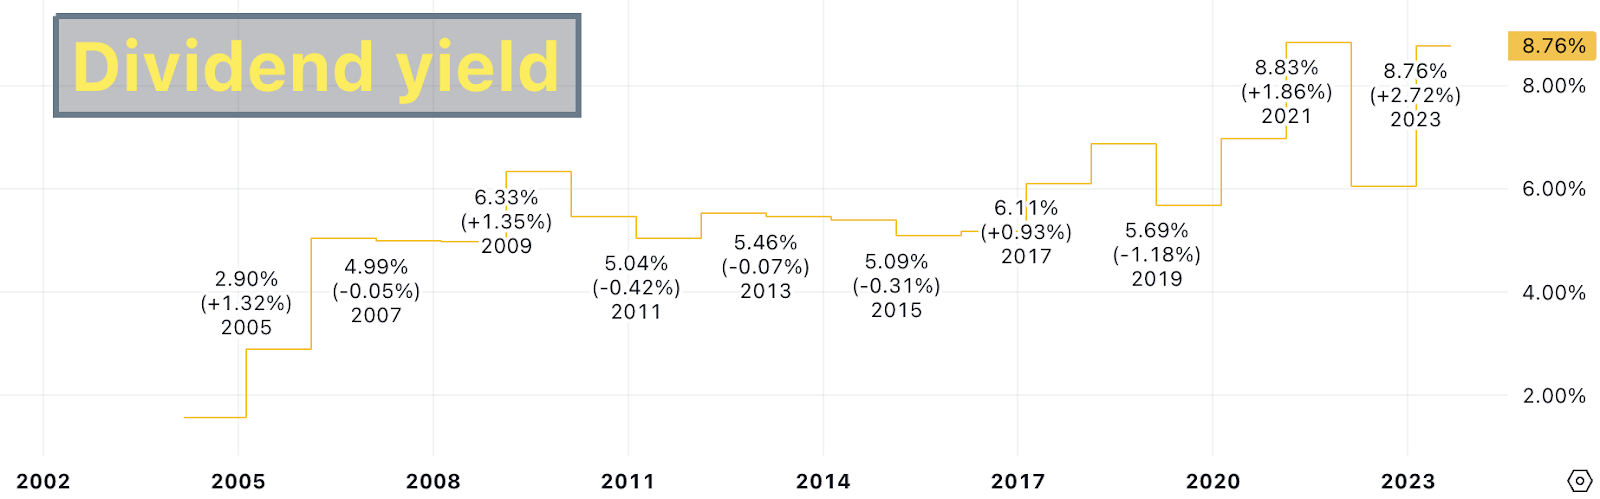
The next chart shows the dividend yield. So this is the yearly percentage return I’d get back from any investment. As we can see, it’s higher than ever. The last ‘step’ on the chart doesn’t even include the latest rise to over 10%. 

Is this good? Not really. The current yield is far higher than historic levels, a red flag that investors aren’t confident in the stock. And based purely on this chart, a 5%-6% yield is more what I’d expect over the long run.

Source: TradingView

This third chart shows the dividend payout ratio. This is the percentage of earnings used to pay the dividend. And that wonky graph tells a story all on its own. 

For 2021, the firm reported very low earnings which is why it’s so high. For 2020 and 2022, the ratio was above 100%, so the company didn’t make enough profits to cover the dividend. The 2023 ratio would have been over 100% too if it weren’t for the one-off €9bn disposal of one of its German operations.

In short, Vodafone hasn’t been earning enough to pay its dividends. And that brings me onto the last and perhaps most revealing chart.

Source: TradingView

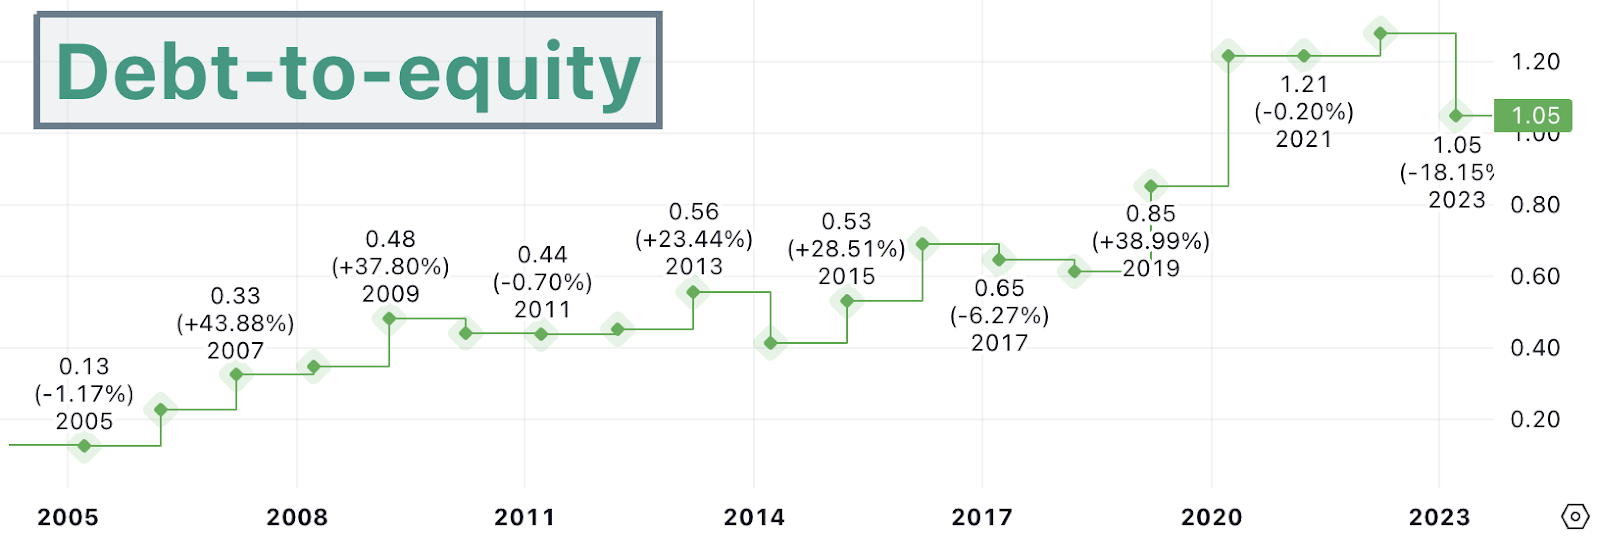
This final chart shows Vodafone’s debt-to-equity (D/E). This is how much debt the firm is in compared to the total shareholder equity. Because it’s a ratio, we can easily compare debt from year to year.

Clearly, debt levels are high right now. That’s not great for the dividend as future earnings may need to be diverted to pay down the debt or to cover financing. I will say though that competitor BT has an even higher D/E of 1.6 right now. So perhaps Vodafone’s debt isn’t too unreasonable.

A buy? 

Taken together, do these charts say that Vodafone is a good buy? Well, I’d have to say no. They show the firm has its work cut out to keep up with those high dividends and that 10%+ yield looks like it’s on shaky ground to me. I’ll be avoiding.

John Fieldsend has no position in any of the shares mentioned. The Motley Fool UK has recommended Vodafone Group Public. Views expressed on the companies mentioned in this article are those of the writer and therefore may differ from the official recommendations we make in our subscription services such as Share Advisor, Hidden Winners and Pro. Here at The Motley Fool we believe that considering a diverse range of insights makes us better investors.

More on Investing Articles

Friends and sisters exploring the outdoors together in Cornwall. They are standing with their arms around each other at the coast.
Investing Articles

£503 buys 14 shares in this FTSE 250 stock that returned 23.9% annually for the last 15 years

This FTSE 250 stock has averaged a huge return for 15 years. At today's price, £503 buys 14 shares. But…

Read more »

Black woman using loudspeaker to be heard
Investing Articles

£1,000 buys 25 shares in this FTSE 100 stock that’s returned 29.2% annually for the last 10 years

This FTSE 100 mining stock has returned close to 30% a year for a decade. At 3,995p, £1,000 buys 25…

Read more »

Female student sitting at the steps and using laptop
Investing Articles

Down 47%, is this growth stock finally worth buying in May?

With a £288m order book and a hidden pipeline of defence and nuclear contracts, is this growth stock now too…

Read more »

House models and one with REIT - standing for real estate investment trust - written on it.
Investing Articles

2 REITs yielding 7%+ to consider for passive income in 2026

A REIT backed by the NHS and another backed by Tesco and Sainsbury's with both yielding 7%+. Here's why I'm…

Read more »

Woman riding her old fashioned bicycle along the Beach Esplanade at Aberdeen, Scotland.
Investing Articles

Just 97 shares of this UK dividend stock generate £238 in passive income

A 5.7% yield, £238 in passive income from just 97 shares, and one of the most divisive dividend stocks on…

Read more »

ISA coins
Investing Articles

£10,000 in an ISA generates a second income of…

The London Stock Exchange is home to some of the world's most generous dividends. But how big a second income…

Read more »

Shot of a senior man drinking coffee and looking thoughtfully out of a window
Investing Articles

Expert recommendations: 2 top income stocks yielding 7%+!

With yields of 7.2% and 7.8% respectively, these two income stocks are catching the eyes of institutional analysts. Should investors…

Read more »

Illustration of flames over a black background
Investing Articles

3 top income-focused stocks to buy in May 2026, according to experts

Looking for a stock to buy for income in May 2026? Experts have flagged these three UK dividend shares as…

Read more »